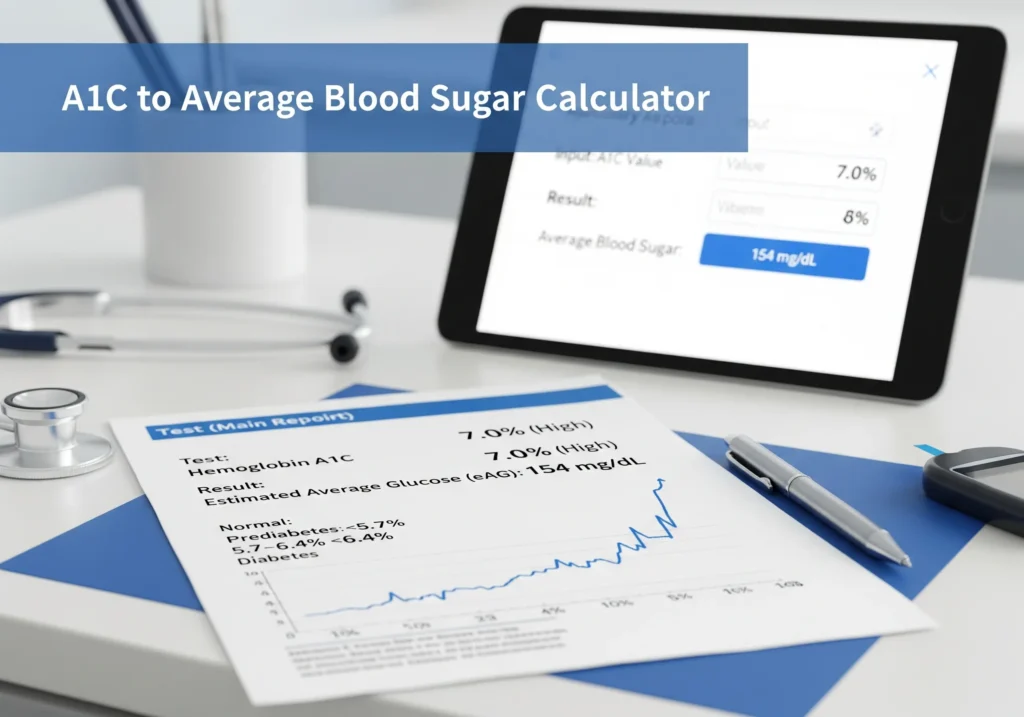
A1C to Average Blood Sugar Calculator
Enter your A1C level (%)
Blood Sugar Levels Over Time
Enter your A1C value to see estimated glucose levels visualized.
A1C → Average Blood Sugar (eAG)
When Maria left her endocrinologist’s office, she held a lab form that read A1C 7.5%. She checks her glucose at home most mornings and usually sees numbers around 160–190 mg/dL. At home she felt uncertain: “Is my meter right? Is the lab right? What does 7.5% actually mean for my day-to-day numbers?”
That’s the exact reason we use the A1C → estimated average glucose (eAG) conversion: it translates the lab percentage into the same units people read on their meters (mg/dL or mmol/L). Once Maria saw the conversion and a little explanation, the numbers clicked — and she could compare her meter logs, her CGM reports and her lab result with confidence.
What is A1C?
A1C (also called HbA1c) measures the percentage of hemoglobin in red blood cells that has glucose attached. Because red blood cells circulate for roughly 2–3 months, A1C reflects the average blood glucose over the previous 2–3 months — not a single day’s readings. This makes it extremely useful for assessing long-term control.
The Formula – How A1C Converts to Blood Sugar
Here’s the standard formula recommended by the American Diabetes Association (ADA):
Estimated Average Glucose (mg/dL) = (28.7 × A1C) – 46.7
👉 Example: If your A1C = 7%
eAG = (28.7 × 7) – 46.7 = 154 mg/dLSo, A1C of 7% ≈ average blood sugar of 154 mg/dL.
How the Calculator Works (Step by Step)
Let’s take Michael’s example (A1C = 7.5%):
- Enter your A1C level (%) → Michael enters 7.5.
- The calculator applies the formula → (28.7 × 7.5) – 46.7.
- The math result → 168 mg/dL.
- Interpretation:
- Below 5.7% → Normal
- 5.7% to 6.4% → Prediabetes
- 6.5% or higher → Diabetes
- For people already with diabetes, target A1C is usually below 7%, unless your doctor sets a different goal.
- Below 5.7% → Normal
Michael now knows his average sugar is about 168 mg/dL, which helps him connect his lab results with daily checks.
Frequently Asked Questions
5.7% – 6.4% = Prediabetes
6.5% or above = Diabetes